Catchment Area Report Example

The Catchment Area Analysis reports (sometimes called the “Leakage” reports) provide several options for viewing, analyzing, and reporting Catchment Area data.  This report provides data on the number of passengers from a given airport’s service area that are “leaking”, traveling to a different airport instead of the local airport to catch a flight.

The Catchment Area Analysis reports assume that the airport has had a Catchment Area report done by the airport staff or by an outside consultant.  There are some numbers from that report that will be needed to take full advantage of the Catchment Area Analysis report.

The Catchment Area Analysis reports are available in four different formats:

  • By Passenger
  • Average One Way Fares
  • Miles
  • Revenue

How To Use:

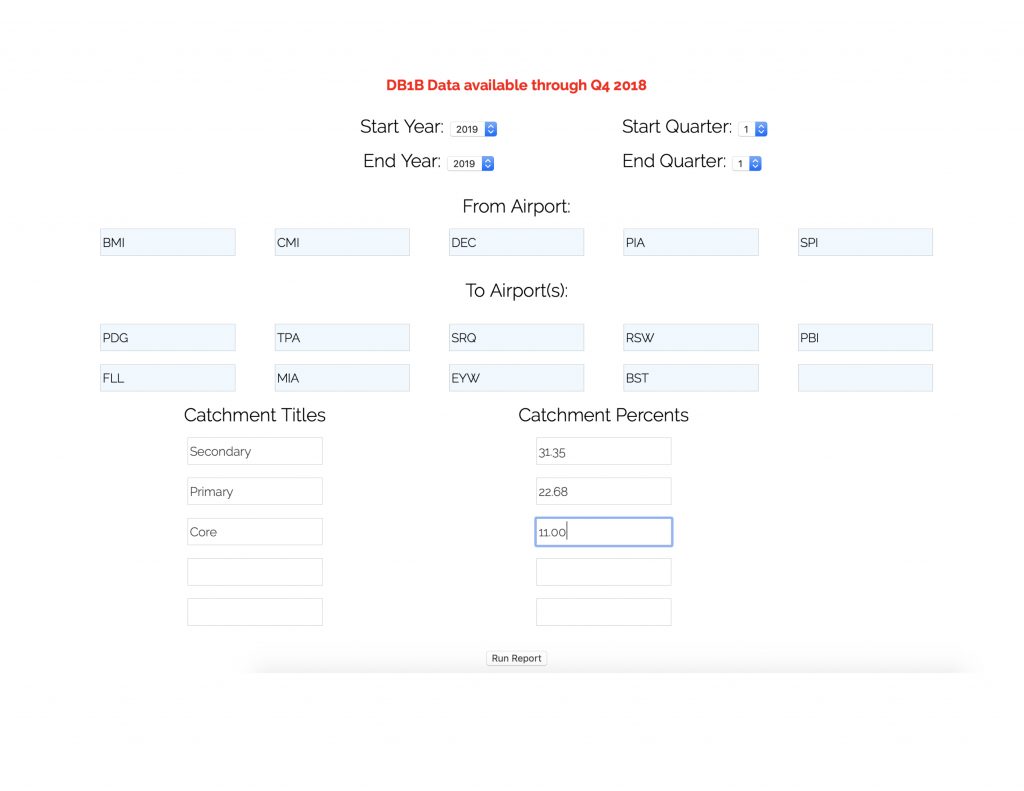
Up to 5 “FROM” airports can be selected and up to 10 “TO” airports can be selected.  The data for these fields will be taken from the published DOT airline passenger data.

Once the desired FROM and TO airports have been selected, the Catchment Areas percentages can be entered.  (Please note that these percentages come from a previously completed leakage study by the airport staff or by an outside consultant.  This report will utilize those previously defined Catchment Areas and percentages, but it cannot calculate the percentages.)

These Catchment Areas designators can be counties, localities, or almost any other geographical areas for which you have previously collected data.

Enter the appropriate percentage to be applied to the given Catchment Area, then click on Run Report.

Report Sample